Strong GDP does not always mean strong markets.
Every quarter, the same headline does the rounds: GDP growth beats estimates, and somewhere on business television, an anchor points to the Sensex as if the two move in lockstep. It is an intuitive story. A growing economy means growing company profits, which should mean rising stock prices. Simple.
Except the data does not agree.
Look closely at India’s GDP growth and Sensex returns over the last two decades, and you find a relationship that is real but far looser than most people assume — one that has decoupled dramatically at exactly the moments investors needed it most. Understanding why is more useful than memorising the correlation number itself.
The assumption everyone starts with
The logic behind “GDP up, market up” is not wrong, it is just incomplete. GDP measures the total value of goods and services produced in the economy — agriculture, government spending, unlisted small businesses, informal sector activity, exports, and more. The Sensex measures the combined market value of 30 large, listed companies, weighted by their float.
Nearly 63% of India’s population is rural, and this segment alone generates roughly 46% of the country’s GDP. Very little of that shows up in the Sensex. Meanwhile, sectors like IT services and banking are heavily represented on the index but are a comparatively smaller slice of the real economy. The two are measuring overlapping but genuinely different things — and that mismatch alone explains a good part of why they drift apart.
What the last 20 years actually show
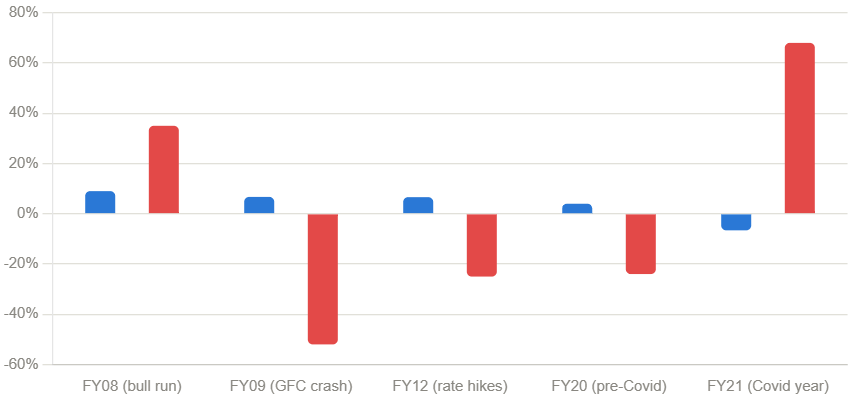
Below is a comparison of India’s GDP growth rate against Sensex returns across five fiscal years that each tell a different part of the story. This is where the “everyone” in the headline gets surprised.
| Fiscal year | GDP growth | Sensex return | What was happening |
|---|---|---|---|
| FY2007-08 | ~9.0% | +35% | Peak of the 2003-08 bull run; growth and markets moved together |
| FY2008-09 | +6.7% | −52%* | Global financial crisis; economy still grew, market cratered on FII outflows |
| FY2011-12 | ~6.6% | −25%** | High inflation, rate hikes, a falling rupee dragged the market down despite decent growth |
| FY2019-20 | +4.0% | −24% | Slowing growth and the onset of Covid-19 dragged both down together |
| FY2020-21 | −6.6% | +68% | India’s sharpest GDP contraction in four decades, alongside Sensex’s best year in over a decade |
*Sensex fell from roughly 20,873 in January 2008 to about 9,093 by late November 2008, even though full-year GDP growth for FY2008-09 came in at a still-positive 6.7%, cushioned by fiscal stimulus. **Calendar year 2011 return; Sensex closed the year down close to 25% amid FII outflows, even as the economy was still expanding at a healthy clip.
Two rows deserve special attention, because they represent the two purest tests of the “GDP equals market” theory — and both fail it.
Exhibit A: A growing economy, a crashing market (2008-09)
By the numbers, FY2008-09 was not a bad year for the Indian economy. GDP still grew by 6.7%, propped up by government stimulus and resilient domestic consumption. Yet Sensex investors lived through one of the worst years in the index’s history, with the market roughly halving in value.
The reason had almost nothing to do with India’s domestic output and everything to do with capital flows. Global banks were collapsing, credit markets froze worldwide, and foreign institutional investors pulled money out of emerging markets, India included, to shore up balance sheets back home. The Sensex reflects investor sentiment and global liquidity as much as it reflects the health of the underlying economy. In 2008, sentiment and liquidity said “sell,” and GDP growth was irrelevant to that decision.
Exhibit B: A shrinking economy, a soaring market (2020-21)
This is the divergence that still confuses people years later, and it is arguably the most important one to understand.
India’s GDP contracted by 6.6% in FY2020-21 — its first full-year contraction in four decades, driven by the Covid-19 lockdown that brought large parts of the economy to a standstill for weeks. By any traditional reading, this should have been a terrible year for stocks.
Instead, the Sensex delivered a gain of around 68% for the fiscal year, its best performance in eleven years, recovering from a low of roughly 25,981 in March 2020 to end the fiscal year near 49,509.
Why? Markets are forward-looking. They do not price where the economy is; they price where investors expect it to be roughly six to twelve months out. By April 2020, markets had already registered the shock. What followed was a bet — correct, as it turned out — on a V-shaped recovery, aided by near-zero global interest rates, a flood of retail investors opening demat accounts during the lockdown, and record foreign portfolio inflows of around $37 billion into Indian equities that fiscal year, compared to just over a billion dollars the year before.
In other words, the stock market was not disagreeing with the GDP number. It was looking past it.
Why the correlation loosens: four real reasons
1. Markets are forward-looking, GDP is backward-looking. GDP data for a quarter is released with a lag of weeks or months and reports what already happened. Stock prices are constantly repricing expectations about the future. This alone guarantees the two will often be out of step, especially at turning points.
2. Liquidity moves markets faster than growth does. Interest rate cuts, foreign portfolio flows, and domestic SIP inflows can push markets up or down over months, independent of what the real economy is doing in that same window. The 2020-21 rally was as much a liquidity story as a recovery story.
3. The Sensex is not the economy. Thirty large-cap, mostly formal-sector companies cannot represent an economy where a large share of activity is unlisted, informal, or agricultural. A boom in construction, agriculture, or small-scale manufacturing can lift GDP without materially lifting the 30 stocks on the index.
4. Valuations matter as much as earnings. A stock market’s return is a function of both earnings growth and how much investors are willing to pay for that growth (the P/E multiple). GDP growth can be steady while the multiple the market assigns to future earnings expands or contracts sharply based on sentiment, global cues, or domestic events — which is exactly what happened in 2008 and again in 2020.
What a correlation number would actually tell you
If you ran the statistics — plotting annual GDP growth against annual Sensex returns since 2000 — the correlation coefficient would likely land somewhere in the weak-to-moderate positive range, not the strong positive relationship a casual chart-watcher might expect. This is a well-documented pattern across most large economies, not something unique to India. Studies of the US relationship between GDP growth and S&P 500 returns have found similarly weak short-term correlations, precisely because the same forward-looking, liquidity-driven dynamics apply there too.
A weak-to-moderate correlation does not mean “no relationship.” It means the relationship is real but is regularly overwhelmed, in any given year, by other forces: global risk appetite, interest rate cycles, currency movements, and the specific sectors that happen to dominate the index at that point in time. Treat GDP as one input among several, not as a standalone predictor of where the Sensex is headed next.
So does GDP matter to markets at all?
Yes — but over a longer horizon than any single quarter or year suggests. Look at the multi-year bull run between 2003 and 2008: sustained GDP growth of 8-9% coincided with the Sensex moving from around 3,200 to over 20,000, a period where the correlation held up strongly. Over long stretches, corporate earnings do tend to track nominal GDP growth reasonably well, and markets do eventually catch up to economic reality.
The mistake is expecting that relationship to hold reliably at the one-year or even one-quarter horizon that dominates financial news cycles. GDP data and Sensex data will keep printing divergent stories in the short run because they are, structurally, answering different questions.
What this means, practically
None of this is a case for ignoring GDP data or dismissing its importance — it remains one of the most useful signals for understanding the direction of the broader economy, employment, and corporate earnings potential over a multi-year horizon. What it does argue for is caution around a specific, common mistake: using a single quarter’s GDP print, in either direction, as a reason to make a large, immediate change to an equity portfolio.
A strong GDP number does not guarantee the market will rally, as 2008 and 2011 showed. A weak or negative GDP number does not guarantee the market will fall, as 2020-21 demonstrated in the most extreme way possible. The relationship between the two is real, it is just noisier, more forward-looking, and more sensitive to global liquidity than a headline chart ever suggests.
The next time GDP data drops and the market moves the “wrong” way, that is not necessarily a contradiction. It may simply be the market doing what it always does: pricing in a future that has not shown up in the GDP numbers yet.
This article is intended for informational and educational purposes and does not constitute investment advice. Historical data has been sourced from National Statistical Office releases, RBI publications, and BSE/Sensex historical records, and figures for fiscal years may differ slightly from calendar-year reporting conventions used by some data providers. Past performance of any index is not indicative of future returns.